Track Daily Sprint Momentum - Ticket360

Interactive Progress Trend Reports on Every Widget
In software development, progress is measured day by day. But standard Jira dashboards only show a single static snapshot of what your backlog looks like right now.
They don't tell you:
Did open bug counts spike today compared to yesterday?
Is the team resolving issues steadily, or did 15 new tickets get dumped into the sprint mid-week?
Are we on track to finish by Friday, or is scope creep quietly inflating our backlog?
To answer these questions using native Jira, you have to build complex burndown gadgets or export historical CSV reports.
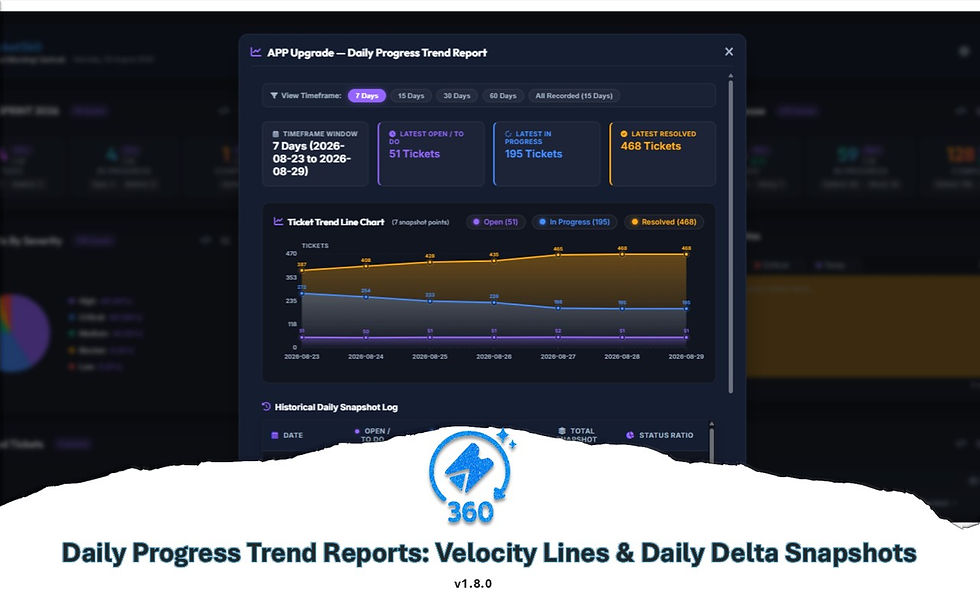
With Ticket360’s Interactive Daily Progress Trend Engine, every KPI widget on your browser dashboard automatically records daily progress snapshots—giving you 1-click visual trend graphs without complex setup!
1. Automated Daily Snapshot Tracking (kpiDailyHistory)
You don't need to manually log numbers or set up cron jobs. Ticket360 works quietly in the background:
Silent Daily Logging: As you work throughout the day, Ticket360 takes automated, lightweight daily count snapshots for each configured KPI widget.
Persistent Historical Metrics: Snapshot data is stored locally in kpiDailyHistory, building a continuous historical timeline across days, weeks, and sprint cycles.
Zero Performance Impact: Snapshot logging executes in milliseconds with zero network overhead.
2. 1-Click Interactive Trend Report Modal with Full-Screen SVG Line Charts
Want to inspect progress trajectory? Simply click any KPI metric card on your dashboard:
Full-Screen SVG Trend Line Graph: Launches a dynamic modal displaying crisp SVG trend lines mapping daily ticket counts over time.
Net Daily Delta Indicators: Instantly spot day-over-day changes with color-coded delta badges (e.g., 🟢 -4 Tickets Closed or 🔴 +6 New Defects).
Interactive Tooltip Data Points: Hover over any node on the line graph to see the exact date, total issue volume, and day-of-week breakdown.
Historical Snapshot Log Table: Scrollable historical log table displaying exact historical snapshot entries with 1-click export capabilities.
3. Proactive Scope Creep & Velocity Monitoring
Daily trend reports transform how Scrum Masters and Product Managers monitor sprint health:
Detect Mid-Sprint Scope Creep Early: If your "Sprint Open Tickets" KPI graph turns upward on Day 4, you know scope creep was added before it impacts sprint burndown.
Track Defect Resolution Trajectory: Watch critical bug counts decline steadily as hard-freeze release dates approach.
Analyze Day-of-Week Velocity Patterns: Identify team output patterns (e.g., peak code merges on Wednesdays vs testing sign-offs on Fridays).
Pro Tips for Agile Analytics
Pro Tip #1: Friday Progress CheckBefore wrapping up your week, click your active sprint KPI cards to review your weekly SVG line graph. Use the net delta log to highlight team accomplishments in your Friday email update!
Pro Tip #2: Long-Term Bug Trend MonitoringSet up a dedicated KPI card with JQL type = Bug AND status != Closed. Over 30 days, watch your trend line chart to verify if technical debt reduction initiatives are working.
Velocity Reality Check: Strategic Questions for Engineering Directors & Agile Leaders
"Are you evaluating sprint trajectory based on daily trend momentum, or just end-of-sprint totals?"Real-World Impact: Waiting until the last day of a sprint to evaluate burndown leads to unexpected rollover. Daily trend graphs reveal slope velocity from Day 1.
"How do Scrum Masters prove to leadership that mid-sprint scope creep impacted delivery commitments?"Real-World Impact: Ticket360's daily snapshot trend reports provide undeniable visual evidence of exact dates when new tickets inflated the sprint backlog.
"How much time do engineering leads spend building custom reporting spreadsheets for weekly executive reviews?"Real-World Impact: Ticket360 generates presentation-ready SVG trend graphs and daily snapshot tables in 1 click directly from the browser tab.
Proactively Drive Sprint Delivery
Stop managing sprint health in the dark. Track daily progress trends on every widget with Ticket360—supported on Chrome, Firefox, Edge, and Opera!
Get Ticket360 Now (Supported on Chrome, Firefox, Edge & Opera):


Comments